
The Lake Lanier Market Report for Q2 2025 tracks how luxury homes priced at $700,000+ performed across sales, pricing, time on market, and risk indicators. These stats inform pricing strategy, marketing, and negotiations in today’s Lake Lanier luxury real estate market.
Lake Lanier Market Overview
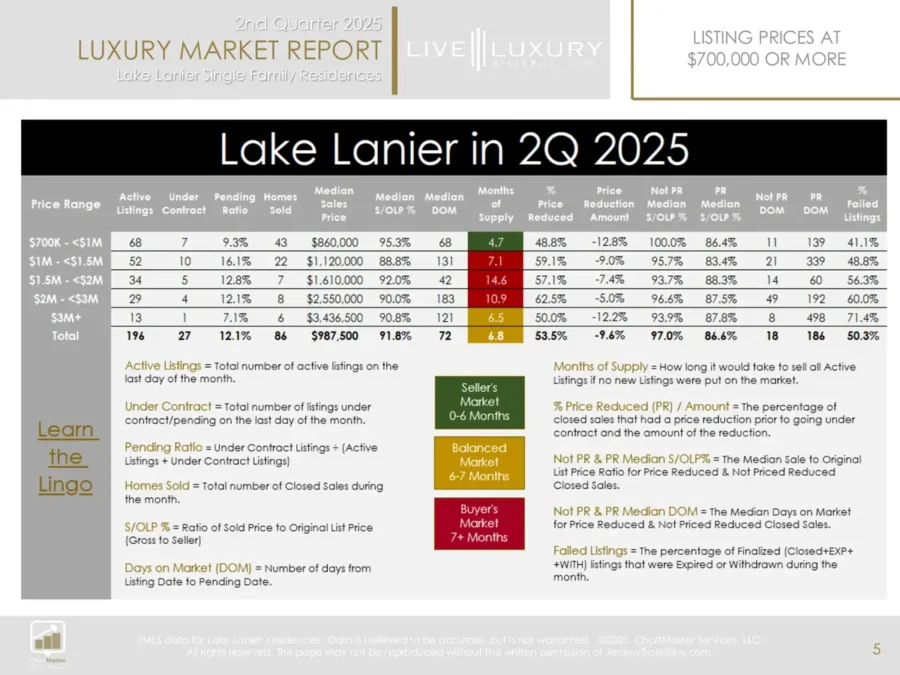
Compared with Q2 2024, total closings were flat overall, with three price brackets showing gains. Inventory measured 6.8 months, keeping conditions broadly balanced, while three ranges leaned toward a Buyer’s Market—translating to more leverage for well-prepared buyers.
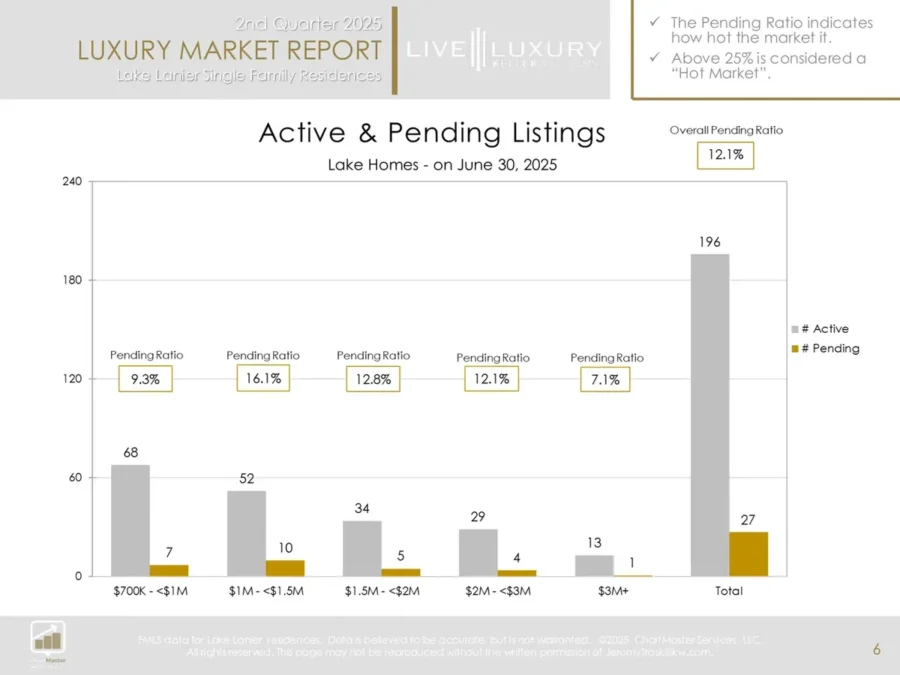
Pending Ratio by price range. A reading above 25% is typically considered a “hot” market.
Pricing & Sale-to-List Performance
The Sale-to-Original-List-Price (S/OLP) averaged 91.8%, signaling modestly softer pricing dynamics year over year. Meanwhile, Days on Market (DOM) extended to 72 days on median—emphasizing the importance of getting list price right from day one.
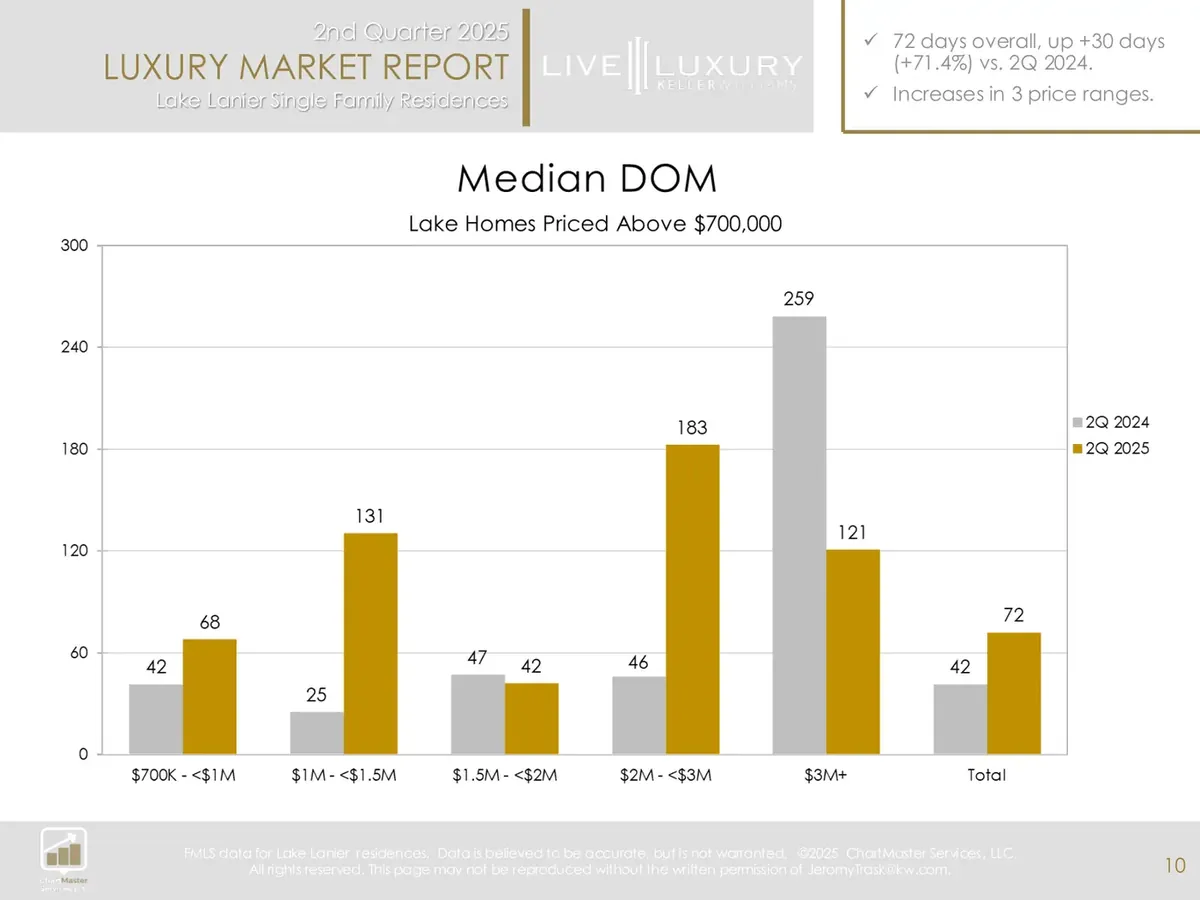
DOM rose while S/OLP edged lower—classic signs of a market rewarding accurate pricing.
Risk Assessment: Reductions & Timing
Price reductions were common in Q2 2025. More than half of sold listings required a reduction, and those properties closed lower versus original list and took considerably longer to sell. For sellers, this underscores the cost of overpricing; for buyers, it highlights opportunity in carefully analyzed segments.
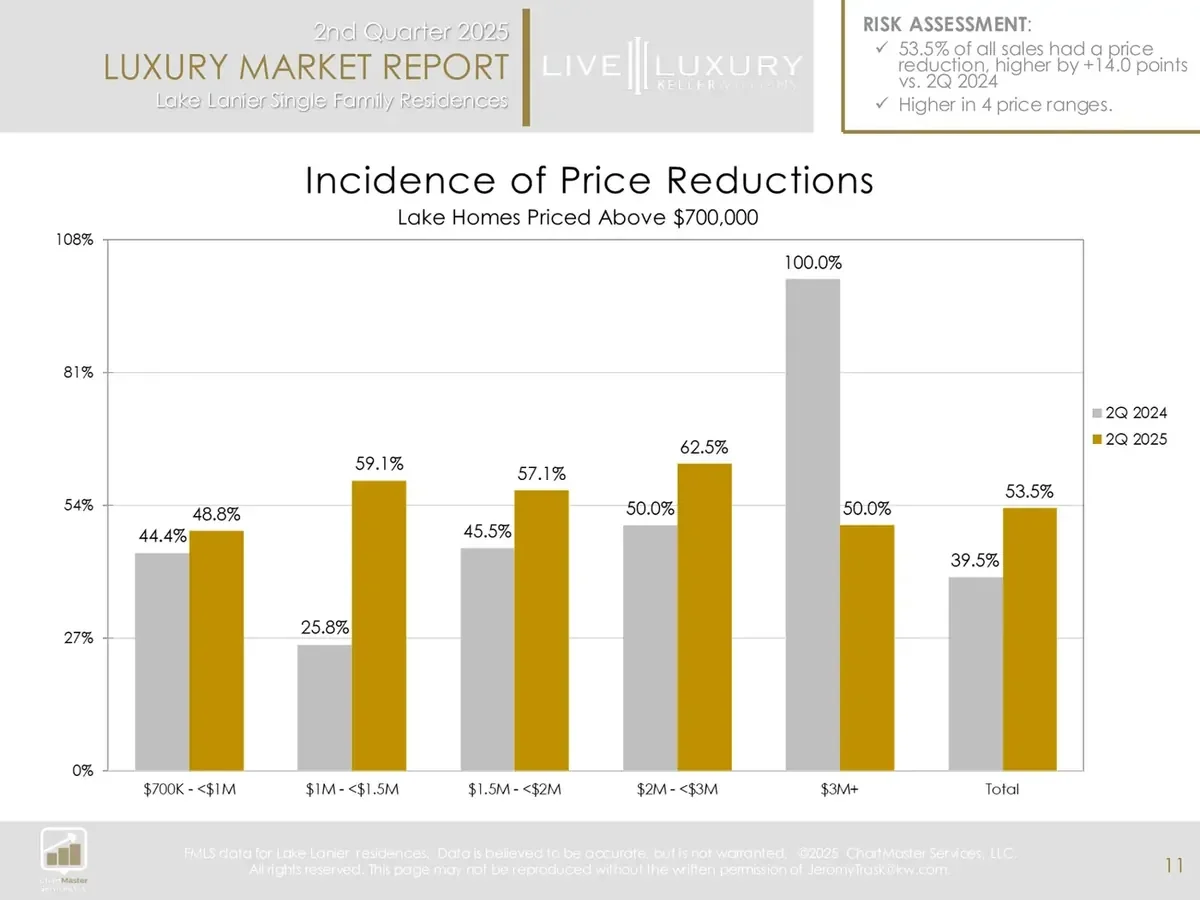
When reductions are needed, sale prices typically fall further from original list and timelines extend materially.
Failure-to-Sell Trends
Failed-to-sell rates were elevated and rose vs. last year across all luxury brackets. This is consistent with a market where buyers are selective and overpriced or under-prepared listings struggle to convert.
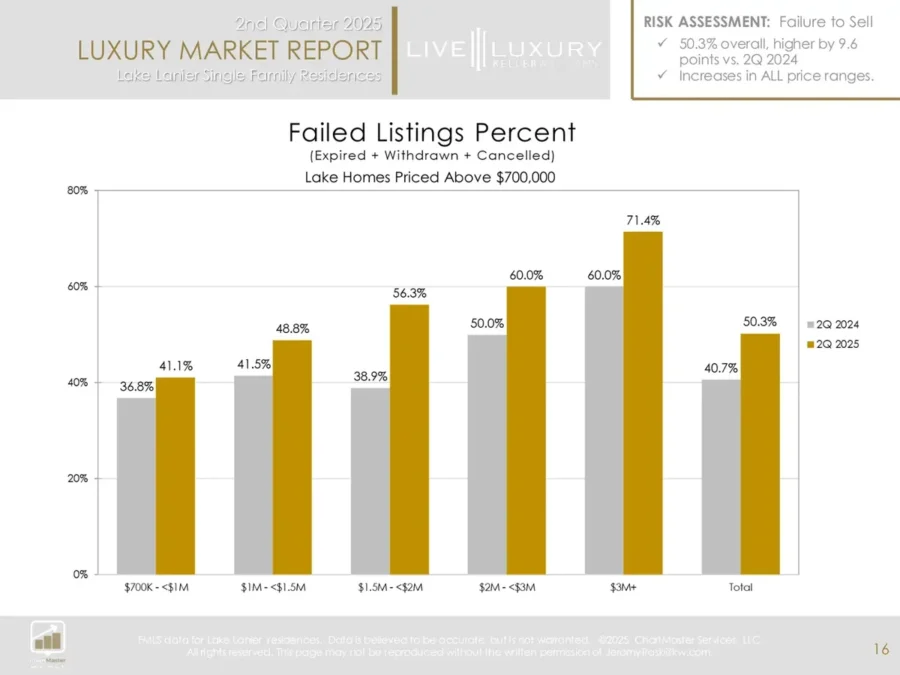
Failure-to-sell by price range shows where pricing accuracy and condition prep matter most.
Key Takeaways for Buyers & Sellers
- Buyers: Longer DOM and balanced-to-buyer-leaning segments create room to negotiate—especially for listings that have taken reductions.
- Sellers: Start with data-driven pricing. Overpricing often leads to reductions, longer timelines, and lower net proceeds than a well-calibrated initial list.
- Agents & Investors: Track segment-level shifts (price band, location, lake access/amenities). Micro-market differences around Lake Lanier are meaningful.
Q2 2025 at a glance: balanced inventory overall, softer S/OLP, longer timelines, and higher failure-to-sell risk.
How to Use This Lake Lanier Market Report
Pair these trends with an on-the-ground pricing review for your specific location. If you’d like a custom breakdown by price band and area around Lake Lanier, contact our team for a tailored analysis. Browse Lake Lanier homes for sale on our website or check out our Ultimate Guide to Buying Lake Lanier Real Estate.
About This Lake Lanier Market Report
Prepared for Keller Williams Realty Live Luxury Group by ChartMaster Services, LLC. Data reflects single-family residences at $700,000+. For a private consultation or a custom Lake Lanier pricing plan, reach out here.